Week1-2
Hello!

We aren’t computer scientists and that’s okay!
We make lots of mistakes. Mistakes are funny. You can laugh with us.
Let’s go, Simba, Pumbaa, and Timon!
1 Add packages
What is an R package?
A package is a small add-on for R, it’s like a phone App for your phone. They add capabilities like statistical functions, mapping powers, and special charts to R.
Install packages: install.packages(“pkgs_name”)
Load packages: library(pkgs-name)
Remove packages: remove.packages(“pkgs_name”)
To install multiple packages: install.packages(c(“pkg1”,“pkg2”))
Tidyverse packages: a collection of packages for tidy data https://www.tidyverse.org/packages/
Exercise 1
Install two packages: data.table and janitor
2 Import data
2.1 Load data from csv files
The main data format used in R is the CSV (comma-separated values). It looks squished together as plain text, but that’s okay! When opened in R, the text becomes a familiar looking table with columns and rows.
library(tidyverse) # library readr has been loaded with tidyverse

file_name_csv <- "./input/ozone_samples_demo.csv" # assign the file with its path to a variable

air_data <- read_csv(file_name_csv)
Sometimes there are a few lines of metadata at the top of the file. You can use skip = n to skip the first n lines.
The data might not have column names. You can use col_names = FALSE to tell read_csv() not to treat the first row as headings, and instead label them sequentially from X1 to Xn:
https://rawgit.com/rstudio/cheatsheets/master/data-import.pdf
2.2 Load data from other text files
We use the function read_delim(file, delim) to read a txt file with any delimiter. Check the cheatsheet of readr for example.
Exercise 2
Read data from ozone_samples_demo.txt
2.3 Load data from excel files
library(readxl) # load readxl library

file_name <- "./input/ozone_samples_demo_excel.xlsx" # assign the excel file to a variable

excel_sheets(file_name) # view all sheet names in the file

air_data <- read_excel(file_name, 1) # read data in the first sheet

#air_data <- read_excel(excel_file, 1, range = cell_cols("A:E"))  # select columns A to E

head(air_data)
2.4 Load data from website or ftp site
library(data.table)

url_1 <- "https://raw.githubusercontent.com/minair/learnR/master/data/ozone_samples_demo.csv"

air_data <- read_csv(url_1) # read data from a website

head(air_data)

url_2 <- "ftp://ftp.ncdc.noaa.gov/pub/data/asos-fivemin/6401-2020/64010K0J4202001.dat"

met_data <- fread(url_2) # read data from a ftp site

download.file(url_2, "./input/64010K0J4202001.dat") # download file to local directory
2.5 Read data from SQL database
2.6 Write to a file
Write to a text file
Write to an excel file
Exercise 3
Save the air_data as plain text file with each row seperated by |
write the air_data to an excel file
3 Explore data
3.1 Data frame info
Use these functions to get to know your data frame
library(dplyr)

glimpse(air_data) # display some portions of the data
names(air_data) # print the column names

nrow(air_data) #  number of rows

ncol(air_data) #  number of columns

summary(air_data) # summary of all column values (ex. max, mean, median), check NA values
https://rstudio.com/wp-content/uploads/2015/02/data-wrangling-cheatsheet.pdf
3.2 Missing values
In R, the missing values are coded by the symbol NA.
is.na(air_data) # check if there're missing values, return a logical matrix

sum(is.na(air_data)) # count the number of missing values

summary(air_data) # another approach to look for missing values

air_data_no_na <- na.omit(air_data) # drop out any rows with missing values

sum(is.na(air_data_no_na))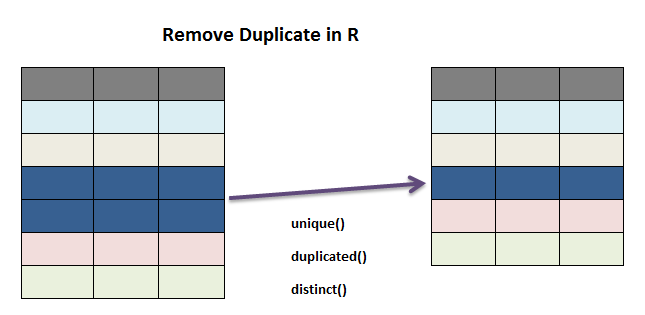
4 Recap
packages
read and write files: plain text, excel
view data frame info
missing values and duplicated values