Week2-1
A New Week!

We aren’t computer scientists and that’s okay!
We make lots of mistakes. Mistakes are funny. You can laugh with us.
Let’s go, Simba, Pumbaa, and Timon!
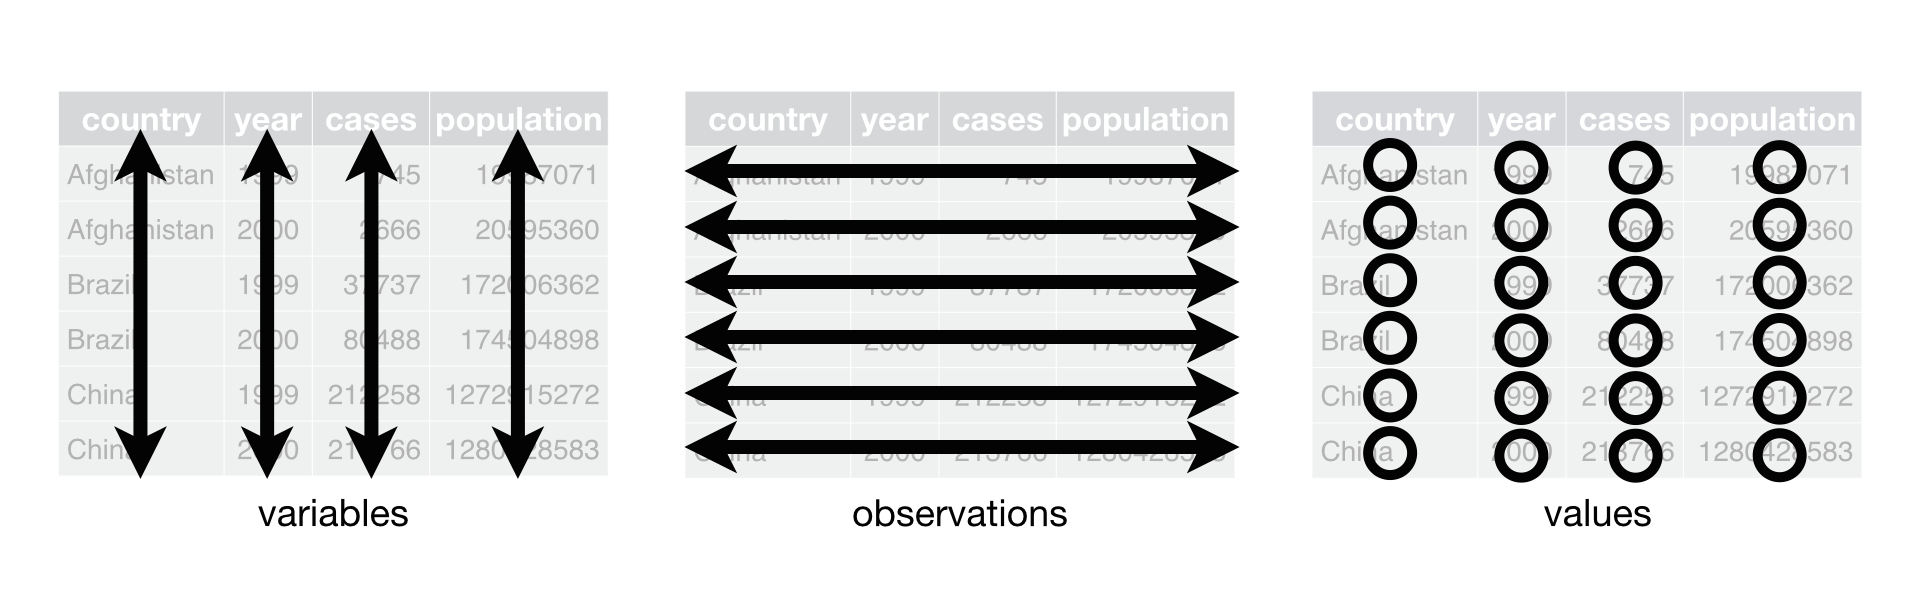
1 Tidy data
In tidy data:
Each variable forms a column.
Each observation forms a row.
Each type of observational unit forms a table
An example of tidy data:
## Ozone Solar.R Wind Temp Month Day
## 1 41 190 7.4 67 5 1
## 2 36 118 8.0 72 5 2
## 3 12 149 12.6 74 5 3
## 4 18 313 11.5 62 5 4
## 5 NA NA 14.3 56 5 5
## 6 28 NA 14.9 66 5 6
## 7 23 299 8.6 65 5 7
## 8 19 99 13.8 59 5 8
## 9 8 19 20.1 61 5 9
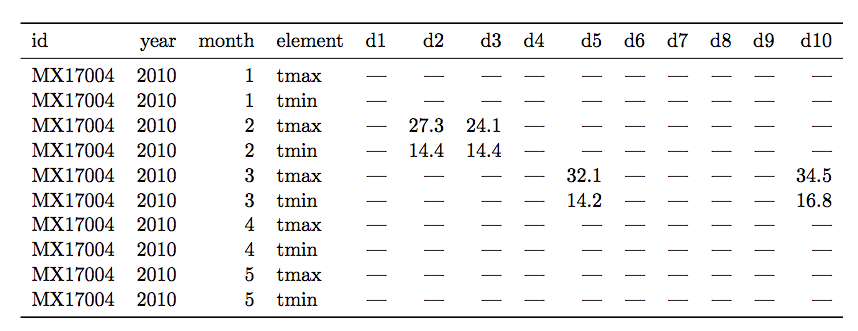
## 10 NA 194 8.6 69 5 10An example of a messy dataset:
2 Manipulate data

dplyr is the hero for most analysis tasks.
With these six functions you can accomplish just about anything you want with your data.
select() : select individual columns to keep or drop
arrange(): sort a table top-to-bottom based on the values of a column
mutate(): add new columns or dupate exsiting columns
filter(): keep only a subset of rows depending on the values of a column
summarize(): calculate a single summary for an entire table
group_by(): sort data into groups based on teh vales of a column
2.1 select()
Use the select() function to:
Pull-out a few columns to create a new table
Drop columns you no longer need
Rearrange or change the order of columns
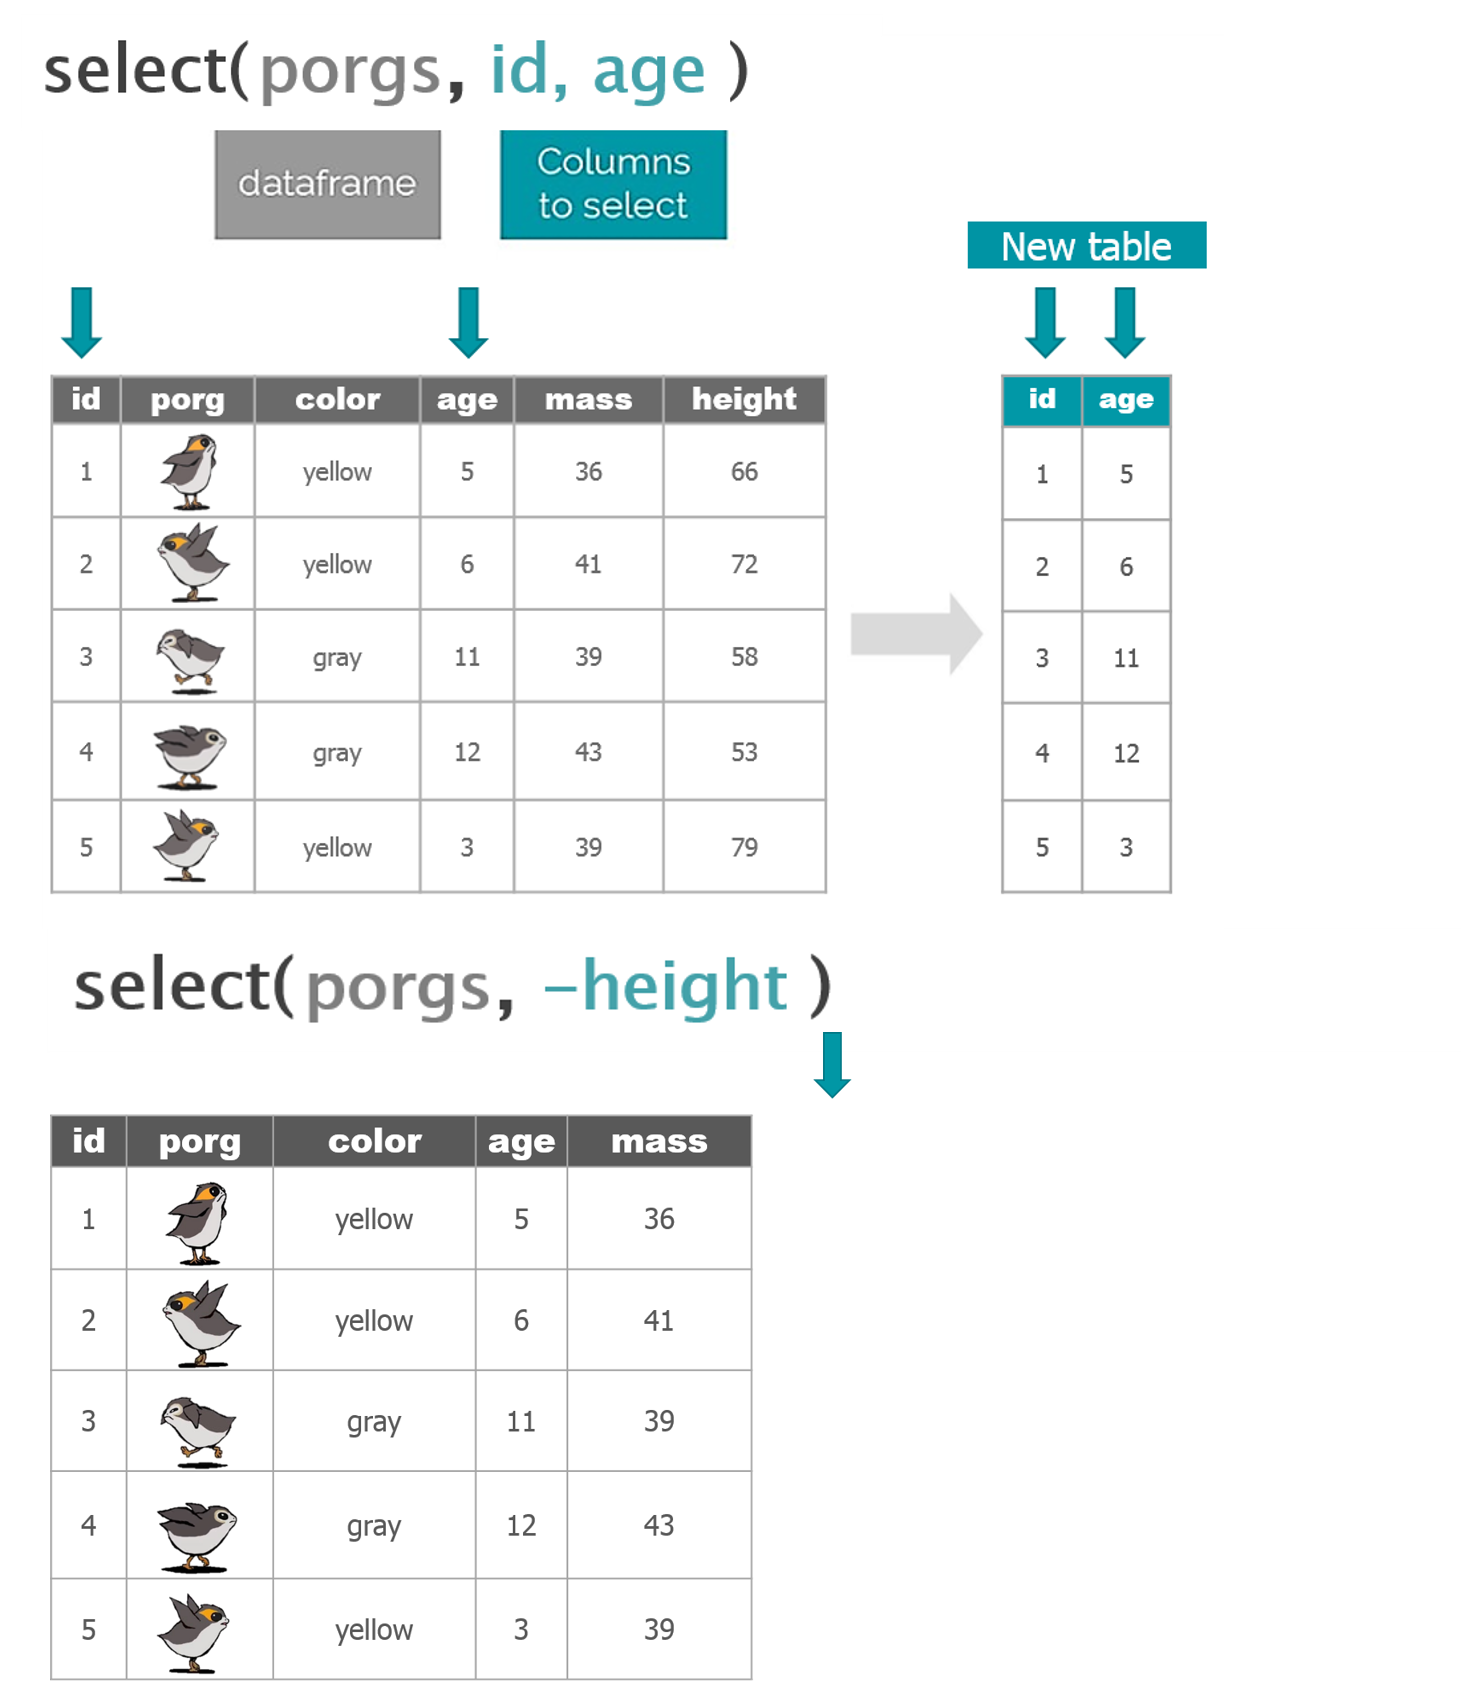
2.1.1 Keep certain columns
2.1.2 drop one or more columns
2.1.3 reorder columns
# Move Month and Day columns first and keep everthing else the same
select(airquality, Month, Day, everything())
Exercise 1
import ozone data from ozone_samples_demo.csv
drop the Latitude and Longitude columns
select SITE, Date, Ozone, UNITS columns
2.2 arrange()
Use arrange() to sort the rows of a data frame based on the values of selected columns
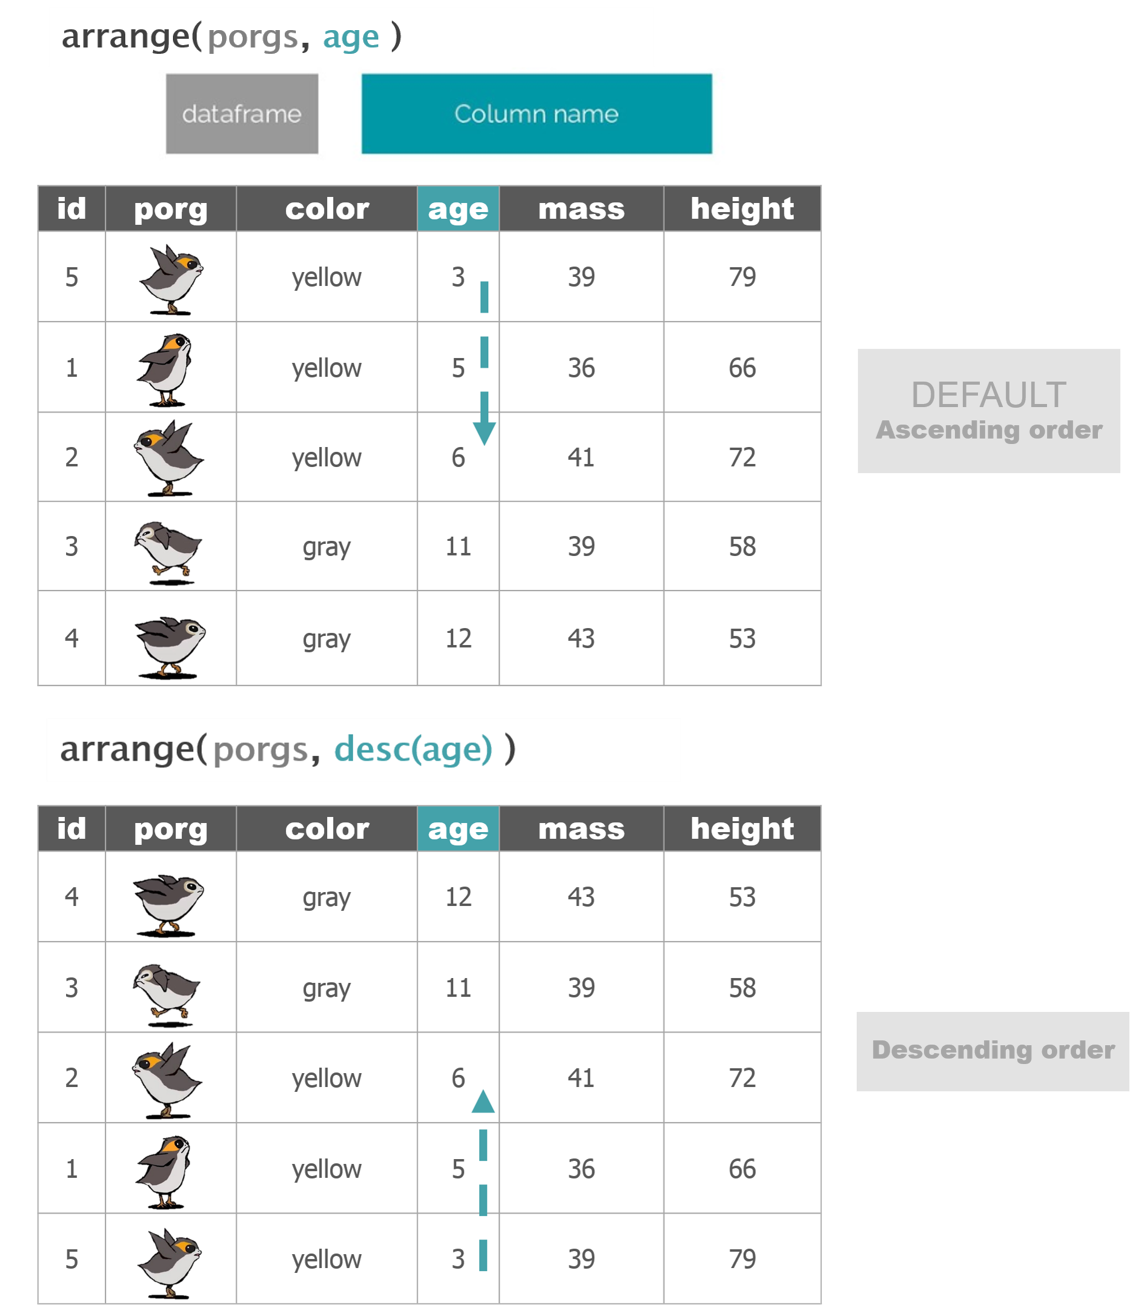
arrange(airquality, Ozone) # arrange rows based the value of ozone, the smallest on top

arrange(airquality, desc(Ozone)) # from high to low
Exercise 2
Try arranging more than one column, such as Ozone and Temp. What happens?
Create a new airquality data frame showing top 10 ozone days, with Month, Day and Ozone columns
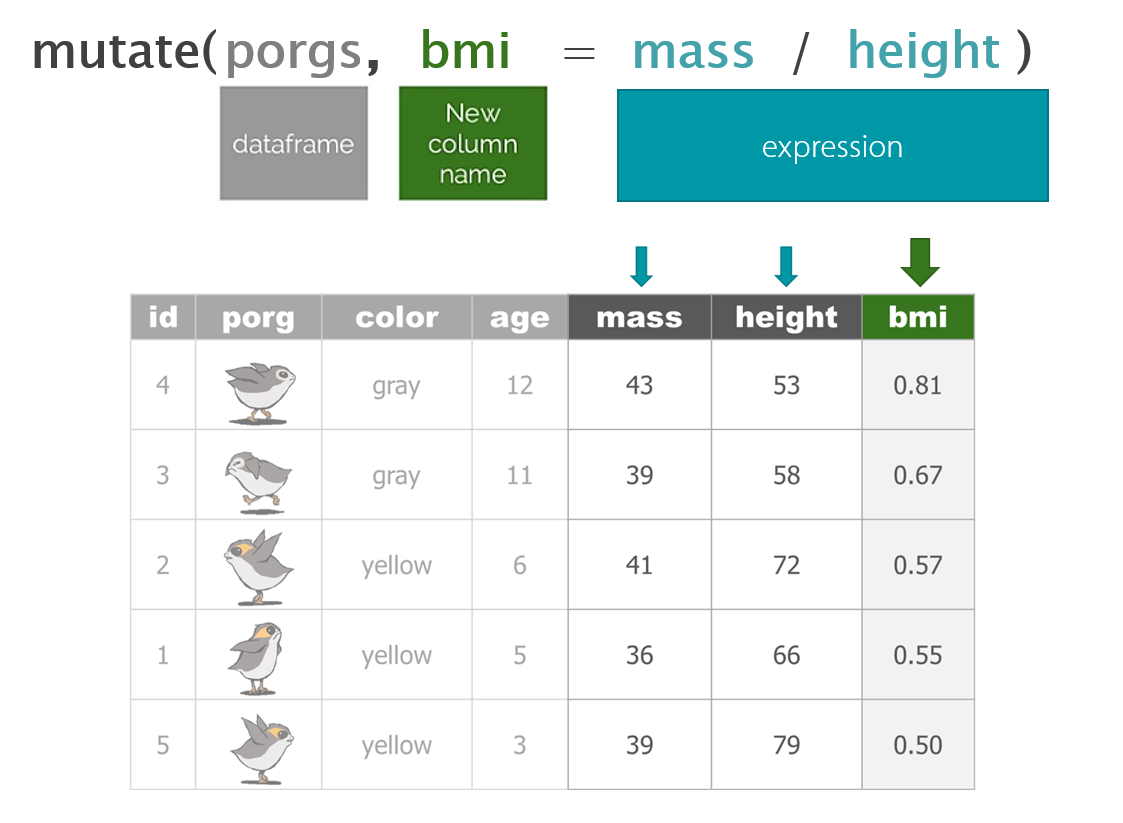
2.3 mutate()
mutate() can edit existing columns in a data frame or add new values that are calculated from existing columns.
2.3.1 Add a column
First, let’s add a column with the city of ozone measurement.
2.3.2 Add several columns
Let’s also add a new column to document the data measurement year.
2.3.3 Change a column
2.3.4 Add calculated columns
We can use mutate() to convert the Wind column from mph to m/s. Multiply the Wind column by 0.447 to get new values for a column named wind_meter.per.second.
Exercise 3
Convert the Temp colum from Fahrenheit to Celsius using T(°C) = (T(°F) - 32) * 5/9
3 Recap
tidy data
select()
arrange()
mutate()